Summary
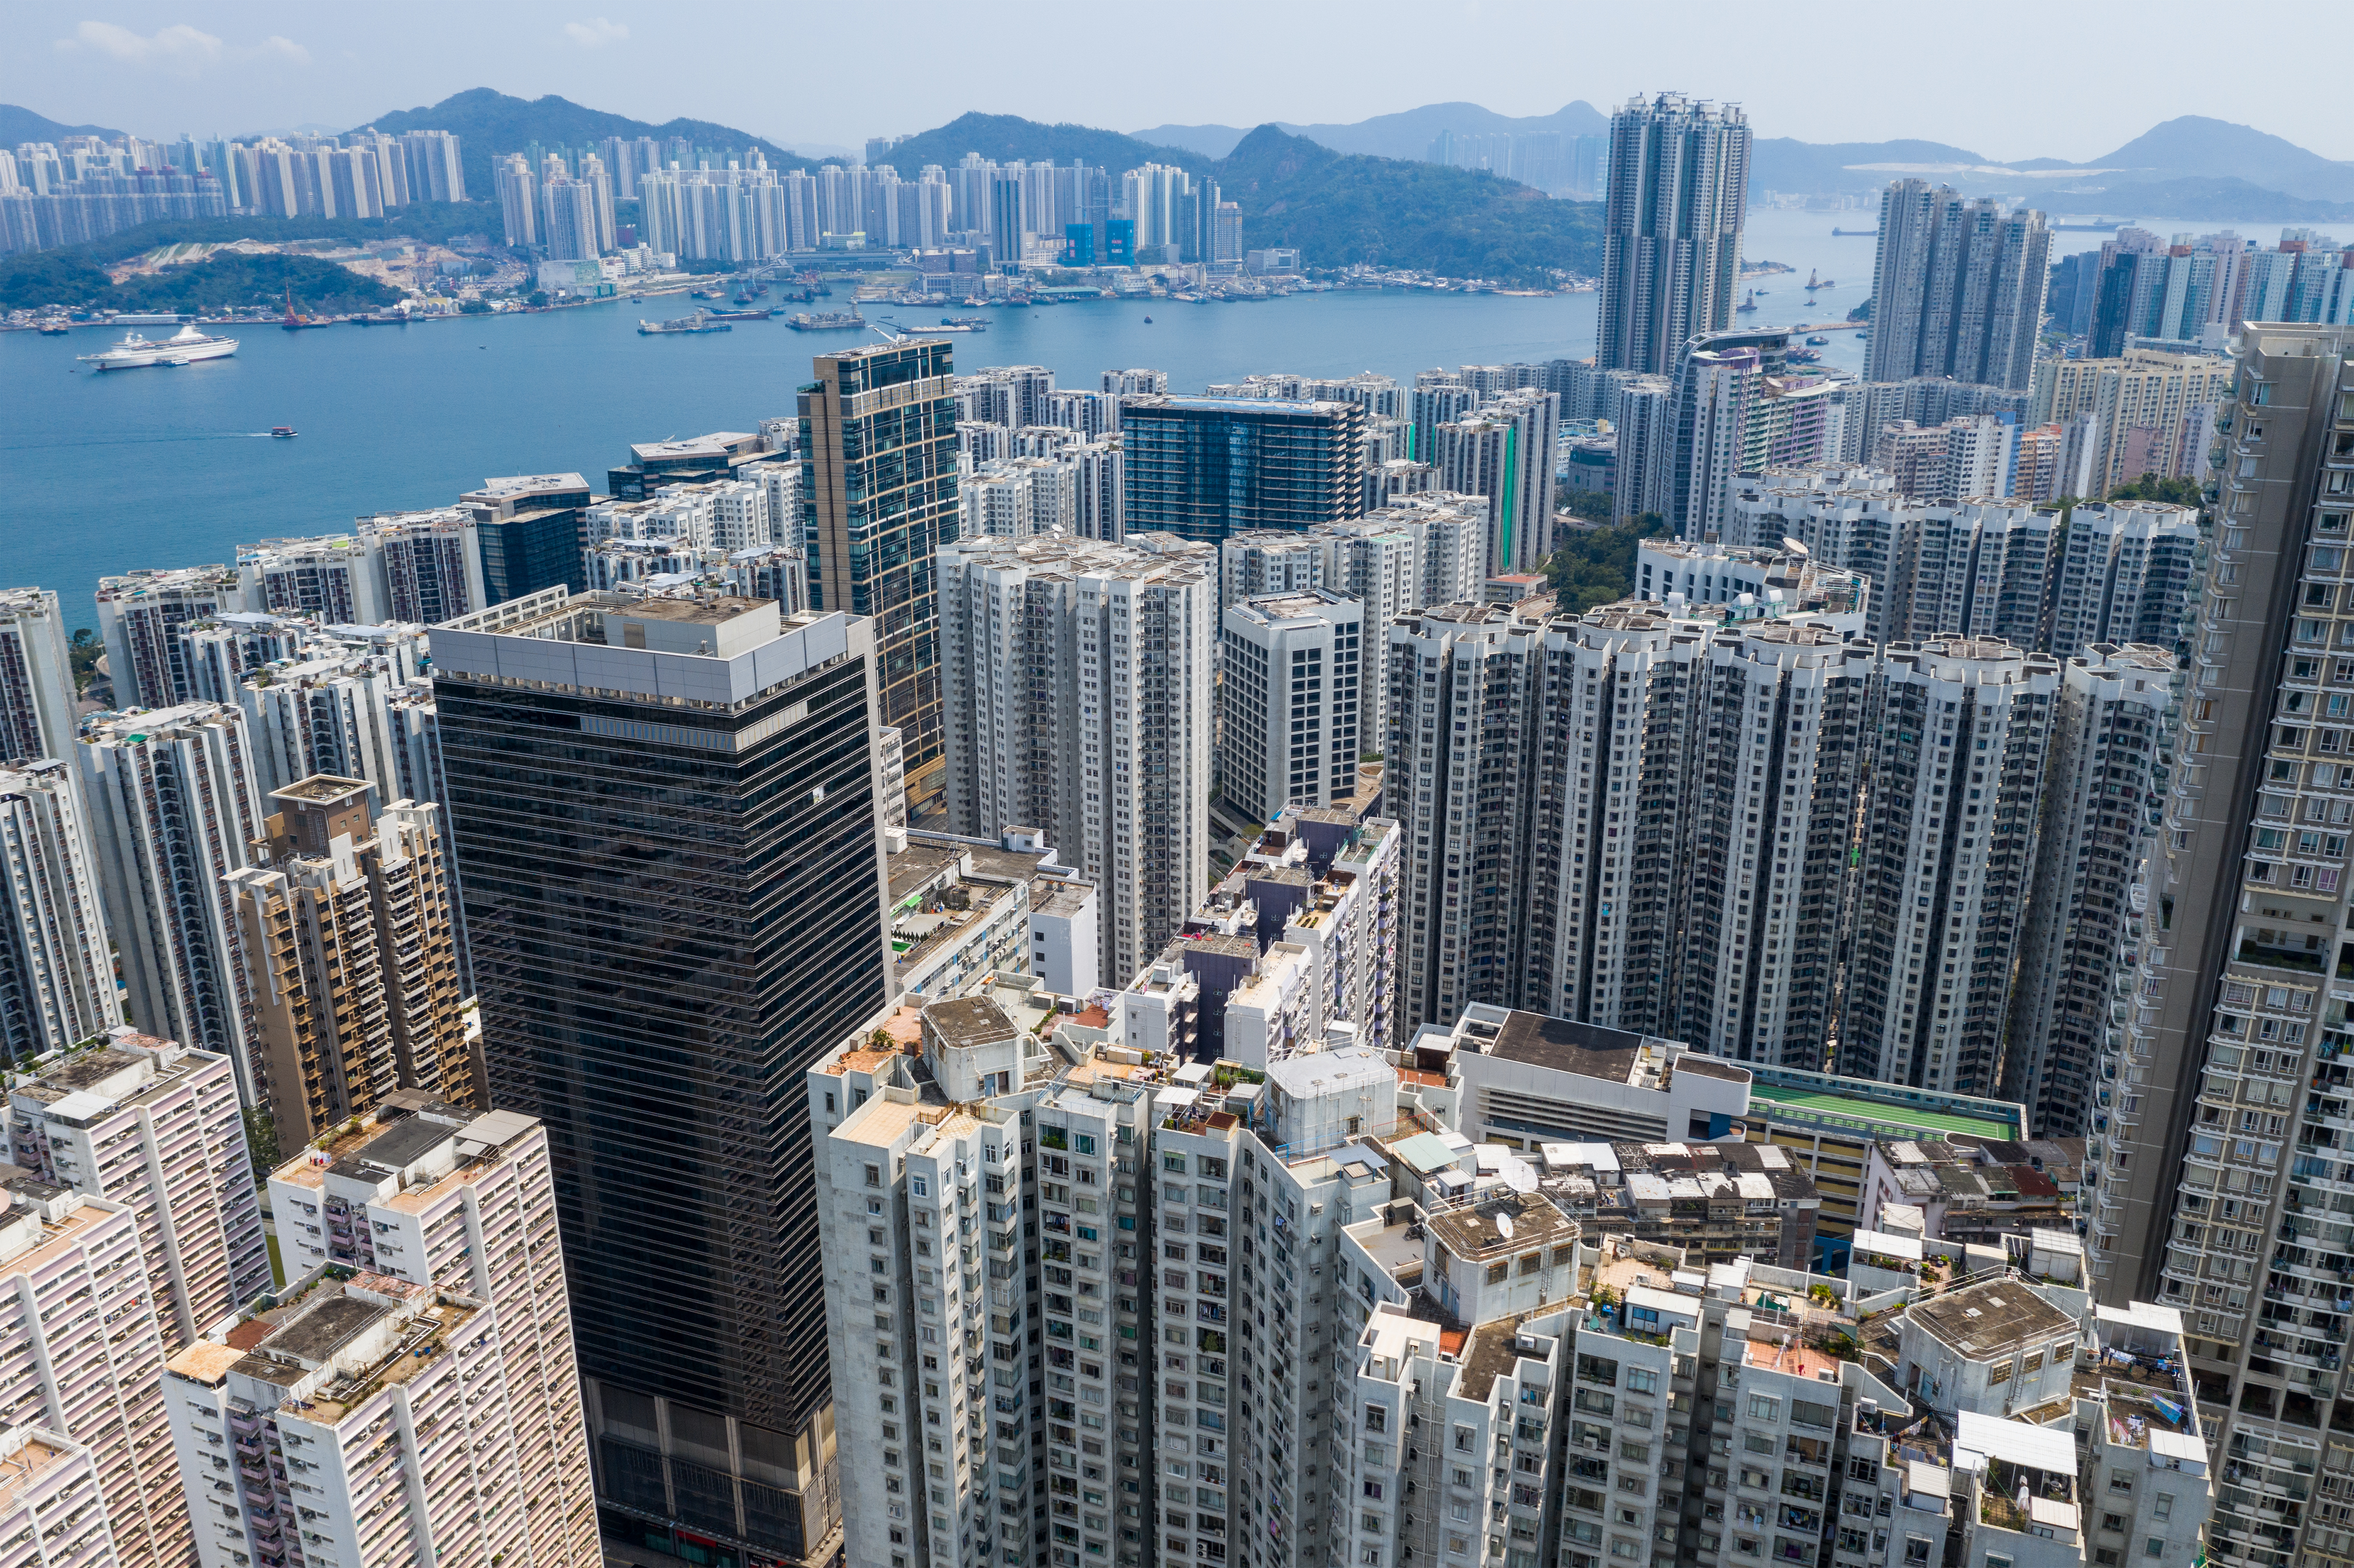
Hong Kong is the world’s most expensive city to buy residential property in 2026, at US$27,753 per square metre in the city centre — followed by Zurich, Seoul, Singapore and Geneva, according to Deutsche Bank’s Mapping the World’s Prices 2026 report (published 13 July 2026), which compares property prices per square metre across 69 cities on 6 continents; despite a 10% price decline from pre-pandemic levels, Hong Kong remains significantly ahead of every other market globally; Cairo is the world’s cheapest city to buy property, and Tokyo offers the lowest prices among developed-market peers
Sydney is the world’s second least affordable housing market in 2026 on a price-to-income basis, with median home prices 13.8 times the median pre-tax household income, according to the 2026 Demographia International Housing Affordability survey cited by Forbes; Hong Kong tops the affordability ranking at 16 times median income; Vancouver (11.8x), San Jose (11.4x) and Los Angeles (10.9x) follow; London’s price-to-income ratio of 8.1x places it as the first European market in the ranking
The gap between the world’s most and least expensive property markets is extraordinary — an 80-square-metre apartment in central Hong Kong costs the equivalent of approximately AUD $3.2 million; the same apartment in Istanbul costs approximately AUD $350,000; Budapest’s property prices have tripled in the past decade (+209%), the largest 10-year increase of any city in the Deutsche Bank report
The world’s most expensive cities to buy property 2026
The following rankings are drawn from Deutsche Bank’s Mapping the World’s Prices 2026 report (published 13 July 2026), which analysed property prices per square metre for apartments in city centres across 69 cities on 6 continents. All prices are converted to euros using average H1 2026 ECB exchange rates.
| Rank | City | Country | Price per sqm (city centre) |
|---|---|---|---|
| 1 | Hong Kong | China SAR | €23,790 (US$27,753) |
| 2 | Zurich | Switzerland | €22,910 |
| 3 | Seoul | South Korea | €21,897 |
| 4 | Singapore | Singapore | ~€20,000+ |
| 5 | Geneva | Switzerland | €19,439 |
| 6 | London | United Kingdom | €17,241 (£14,782) |
| 7 | Paris | France | €12,771 |
| 8 | Vienna | Austria | €12,483 |
| 9 | Munich | Germany | €11,435 |
| 10 | Milan | Italy | €9,378 |
| 11 | Amsterdam | Netherlands | €9,273 |
| — | Madrid | Spain | €7,831 |
| — | Rome | Italy | €7,328 |
| — | Athens | Greece | €3,443 |
| — | Istanbul | Turkey | €2,646 |
| — | Cairo | Egypt | Cheapest globally |
Source: Deutsche Bank Mapping the World’s Prices 2026 (July 13, 2026). Singapore exact figure not separately disclosed in report excerpts reviewed; confirmed in top 5 by The Standard HK (August 2026). Prices are for apartments in city centres and may differ significantly from suburban or regional markets.
Hong Kong — the world’s most expensive property market
Hong Kong has held the top position in the Deutsche Bank property ranking for consecutive years, even as prices have fallen significantly from their 2021 peak. Despite a 10% decline from pre-pandemic levels, and an approximate 30% fall from the September 2021 peak (per SCMP), Hong Kong’s property market remains far ahead of every other city globally.
At US$27,753 per square metre, a 60-square-metre apartment in central Hong Kong costs approximately US$1.66 million — or roughly AUD $2.4 million at current exchange rates.
Why is Hong Kong so expensive? Hong Kong’s extreme property prices reflect a unique combination of factors: extremely limited land supply on a territory of just 1,114 square kilometres; a concentrated population of over 7 million; decades of capital inflows from mainland China; historically low interest rates (prior to the current cycle); and a land auction system that has kept new supply constrained.
Affordability: Hong Kong’s price-to-income ratio stands at approximately 16x — meaning the median household would need to save their entire pre-tax income for 16 years to afford the median-priced home (Demographia/Forbes 2026). In terms of mortgage repayments as a percentage of after-tax income, Hong Kong ranks in the top quarter of the world’s least affordable cities at 150% (Deutsche Bank 2026).
Zurich and Geneva — Switzerland dominates
Switzerland places two cities in the global top five — Zurich at €22,910 per square metre and Geneva at €19,439 per square metre, making Switzerland the most expensive country in the world for city-centre property.
Zurich consistently ranks as one of the world’s most expensive cities across virtually every metric: cost of living, wages and housing. A cappuccino in Zurich costs more than a full meal in Mumbai, according to the Deutsche Bank report. Property prices reflect the city’s status as a global financial and pharmaceutical hub, its extremely high wages and its role as a destination for high-net-worth individuals and international corporations.
Geneva is the seat of numerous international organisations including the United Nations, the World Health Organization and the Red Cross, drawing a large expatriate population that sustains demand at the upper end of the market.
An 80-square-metre apartment in central Zurich or Geneva costs well over €1 million — Zurich and Geneva are among only four cities in Europe where an 80sqm city-centre apartment crosses that threshold (the others being London and Paris).
Seoul — Asia’s rising property market
Seoul ranks third globally at €21,897 per square metre — a reflection of South Korea’s rapid economic development, very limited urban land supply within the Seoul Capital Area and strong cultural preference for homeownership.
South Korean property prices surged through the early 2020s, driven by low interest rates and demand in key districts (Gangnam, Seocho, Mapo). The Bank of Korea’s subsequent rate increases have cooled the market somewhat, but Seoul remains one of the world’s most expensive property markets on a per-square-metre basis.
Singapore — Asia’s city-state
Singapore places in the global top five — a remarkable result for a city-state of just 733 square kilometres. Singapore’s property market is shaped by severe land constraints, a large expatriate professional population, strong economic growth and government policies that separate the public housing market (HDB flats) from the private market.
The figures in the Deutsche Bank report reflect private apartments in the city centre — Singapore’s HDB public housing market, which houses approximately 80% of residents, operates under a separate and more affordable system.
London — the most expensive European capital
London ranks sixth globally and first among European capitals at €17,241 per square metre — approximately 35% more expensive than Paris on a per-square-metre basis.
London’s property market is one of the most globally significant: it attracts international investors, has an extreme shortage of housing supply relative to demand, and is shaped by a planning system that has historically constrained new construction. The outer London boroughs and commuter belt are significantly more affordable than the city centre figures in the Deutsche Bank report.
For Australians and New Zealanders on Working Holiday Visas in the UK: buying property in London at these prices is effectively out of reach for most WHV holders. Renting is the norm. The UK stamp duty land tax (SDLT), mortgage assessment rates and deposit requirements add further barriers for first-time buyers in London.
Sydney — the world’s second least affordable city
While Sydney does not appear in the Deutsche Bank per-square-metre ranking (which focuses on city-centre apartments across 69 primarily northern hemisphere cities), it ranks second globally in the Demographia/Forbes affordability index with a price-to-income ratio of 13.8x — meaning the median Sydney household would need 13.8 years of pre-tax income to cover the median home price.
Sydney’s median house price in 2026 continues to reflect extraordinary pressure from population growth (driven by migration), chronic housing undersupply, infrastructure constraints and planning restrictions that have limited new construction relative to demand. Melbourne and other Australian capital cities appear further down the affordability index but remain significantly more expensive than global averages.
For migrants arriving in Australia: the Sydney property market presents a formidable barrier to homeownership. The First Home Guarantee (5% deposit, no LMI, 35,000 places annually) and the First Home Super Saver Scheme (FHSS, up to $50,000 withdrawn from superannuation for a deposit) are the key government assistance programs available to eligible permanent residents and citizens.
The most expensive US cities
The US does not appear near the top of the Deutsche Bank per-square-metre ranking, but several American cities rank among the world’s least affordable on a price-to-income basis.
US median sale prices 2026 (Redfin):
| City | Median sale price | Price-to-income ratio |
|---|---|---|
| San Jose | US$1,730,000 | 11.4x |
| San Francisco | US$1,650,000 | — |
| San Diego | US$930,000 | — |
| Los Angeles | US$930,000 | 10.9x |
| Honolulu | — | 10.5x |
San Jose and Los Angeles rank among the world’s least affordable on income grounds, driven by the extraordinary concentration of technology sector wealth in the San Francisco Bay Area and the chronic housing shortage in Southern California.
The most expensive European cities
Within Europe, the Deutsche Bank report reveals wide variation — from €22,910 per square metre in Zurich to just €2,646 in Istanbul.
| City | Price per sqm | Notes |
|---|---|---|
| Zurich | €22,910 | World’s second most expensive |
| Geneva | €19,439 | World’s fifth |
| London | €17,241 | Most expensive European capital |
| Paris | €12,771 | 35% cheaper than London |
| Vienna | €12,483 | — |
| Munich | €11,435 | Most expensive German city |
| Milan | €9,378 | — |
| Amsterdam | €9,273 | — |
| Madrid | €7,831 | — |
| Rome | €7,328 | — |
| Athens | €3,443 | — |
| Istanbul | €2,646 | Cheapest in Europe |
Notable findings: Munich, not Berlin, is the most expensive German city. Budapest’s property prices have tripled (+209%) in the past ten years — the largest decade-long increase of any city in the report. An 80sqm apartment exceeds €1 million in only four European cities: Zurich, Geneva, London and Paris.
The most affordable markets globally
At the other end of the spectrum:
Cairo is the world’s cheapest city to buy property in the Deutsche Bank 2026 report. Istanbul at €2,646 per sqm and Athens at €3,443 per sqm are the most affordable European markets — along with Brussels (€4,380 per sqm) and Birmingham. Tokyo offers the lowest property prices among developed-market peers — a reflection of Japan’s unique combination of currency weakness (the yen fell 51% against the USD between 2012 and 2026), modest inflation (+20% in the same period) and subdued wage growth, as well as a planning system that has historically allowed more housing supply than comparable global cities.
What it means for migrants sending money home
Property is a major financial goal for migrant communities sending money to the Philippines, India, Vietnam, Nepal and beyond. Many Australians and New Zealanders from these communities send remittances specifically to help family members purchase or build homes in their home countries.
Property prices in key OrbitRemit destination countries — while rising — remain a fraction of Sydney, Melbourne or Auckland prices, meaning remittances can still meaningfully contribute to homeownership for family overseas.
FAQs (frequently asked questions)
What is the most expensive city to buy property in the world in 2026?
Hong Kong, at US$27,753 (approximately €23,790) per square metre for a city-centre apartment, according to Deutsche Bank’s Mapping the World’s Prices 2026 report.
What is the most expensive city to buy property in Europe in 2026?
Zurich, at €22,910 per square metre, followed by Geneva (€19,439) and London (€17,241).
How does Sydney rank globally for property affordability?
Sydney is the world’s second least affordable housing market on a price-to-income basis, with median home prices 13.8 times the median pre-tax household income, according to the 2026 Demographia affordability survey cited by Forbes. Hong Kong (16x) is the only market ranked less affordable.
What is the cheapest city to buy property in Europe?
Istanbul, at €2,646 per square metre, followed by Athens at €3,443 per square metre, according to the Deutsche Bank 2026 report.
Which city has seen the biggest property price increase over 10 years?
Budapest — property prices tripled (+209%) in the decade to 2026, the largest 10-year increase of any city in the Deutsche Bank Mapping the World’s Prices 2026 report.
Why is Tokyo relatively cheap for a major global city?
Japan’s yen fell approximately 51% against the USD between 2012 and 2026, while domestic inflation rose only about 20% in the same period. Combined with subdued wage growth and a planning system that permits more housing supply than comparable cities, Tokyo offers among the lowest property prices of any developed-market global city.
Related guides
- The world’s most powerful passports 2026 →
- What is the First Home Super Saver Scheme (FHSS)? →
- What is LMI in Australia? →
- Singapore travel guide 2026 →
- Send money to India from Australia →
Property prices are for apartments in city centres and reflect the Deutsche Bank Mapping the World’s Prices 2026 report (July 13, 2026) converted to euros at H1 2026 ECB average exchange rates. AUD equivalents are approximate based on September 2026 exchange rates and may vary. Affordability ratios are from the Demographia International Housing Affordability 2026 survey as cited by Forbes and Voronoi (2026). Last updated October 2026.
Sources: Deutsche Bank Research Institute — Mapping the World’s Prices 2026 (July 13, 2026) | thestandard.com.hk — Zurich and Geneva top world’s costliest cities; Hong Kong stays priciest housing market (August 2026) | euronews.com — Which cities are the most expensive to buy an apartment in Europe? (August 30, 2026) | visitworld.today — Where Are Apartments the Most Expensive in Europe: A Ranking of Cities in 2026 | voronoiapp.com — Where It’s Hardest to Afford a Home (Forbes/Demographia 2026) | redfin.com — The 10 Most Expensive Cities in the U.S. in 2026 | SCMP — Hong Kong tops global list for priciest homes despite property slump: Deutsche Bank | theideafarm.com — Deutsche Bank Mapping the World’s Prices 2026 (July 13, 2026)


